Figures
↓ Figure 1. MRI findings consistent with
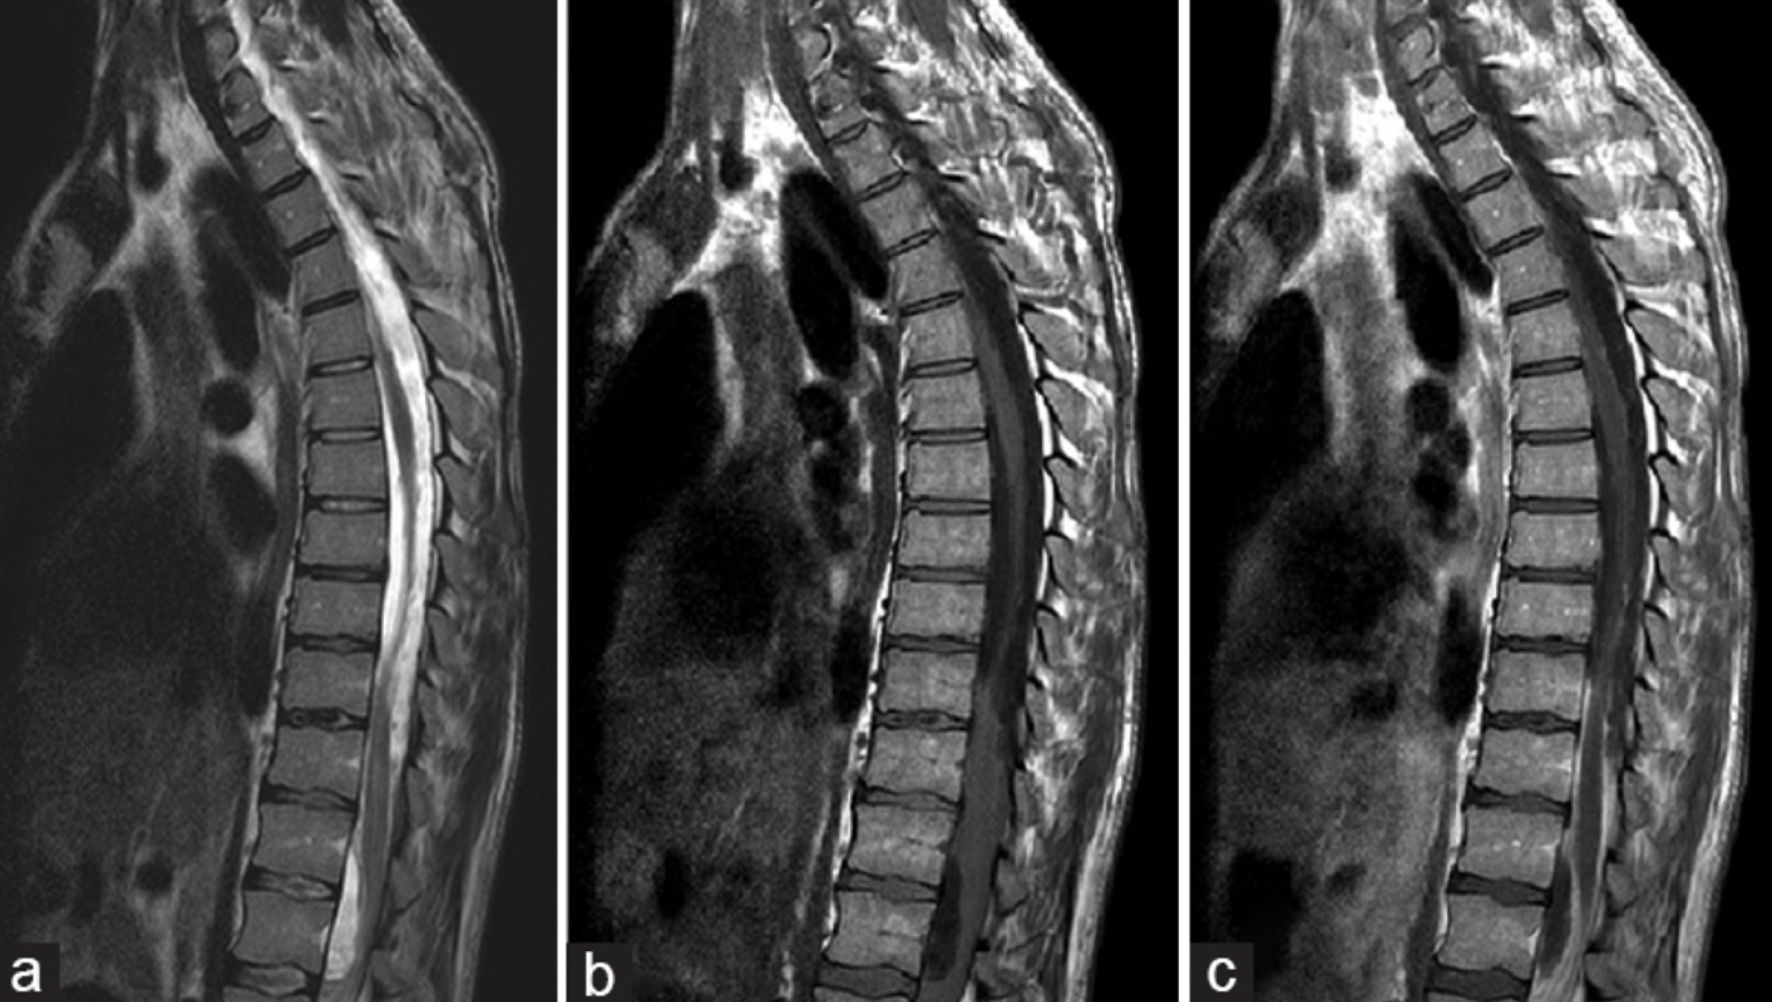
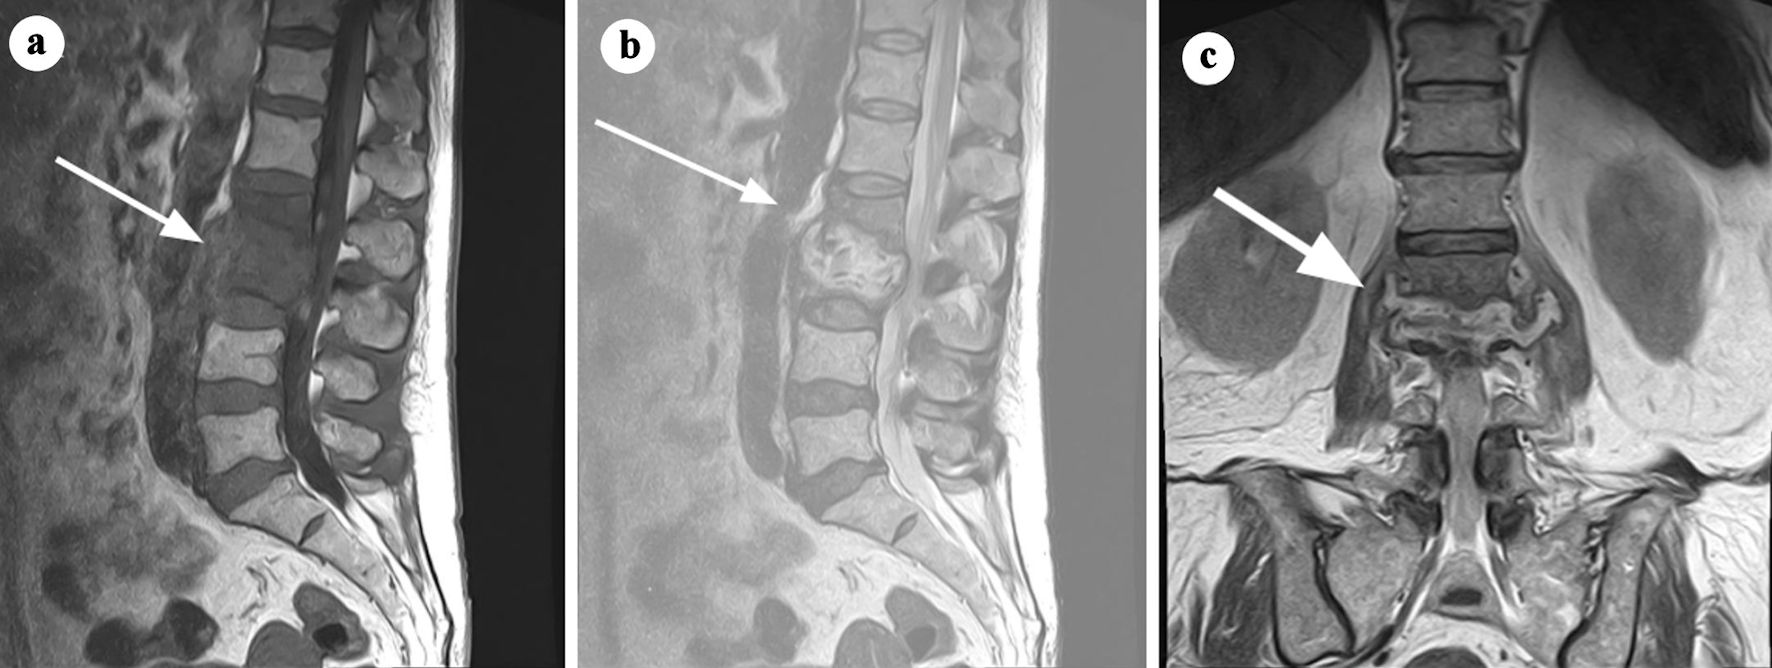
spondylodiscitis at the L2-L3 level. (a) T1-weighted sagittal MRI showing hypointense signal within the
L2-L3 intervertebral disc and adjacent vertebral endplates, indicative of inflammation and structural
damage (arrow). (b) T2-weighted sagittal MRI demonstrating a hyperintense signal in the L2-L3
intervertebral disc, reflecting edema and fluid collection (arrow). (c) Coronal short tau inversion
recovery (STIR) MRI highlighting an elevated signal infiltrating the L3 vertebral body, superior and
inferior endplates of L2, and the paravertebral space, involving the psoas muscles and posterior wall
(arrow). These findings result in neuroforaminal stenosis with contact to the emerging nerve roots at
L2-L3, suggestive of an infectious process with possible infiltrative characteristics. Adapted from
Gonzalez Herrera et al [11] (rID: 188070). MRI: magnetic resonance imaging.
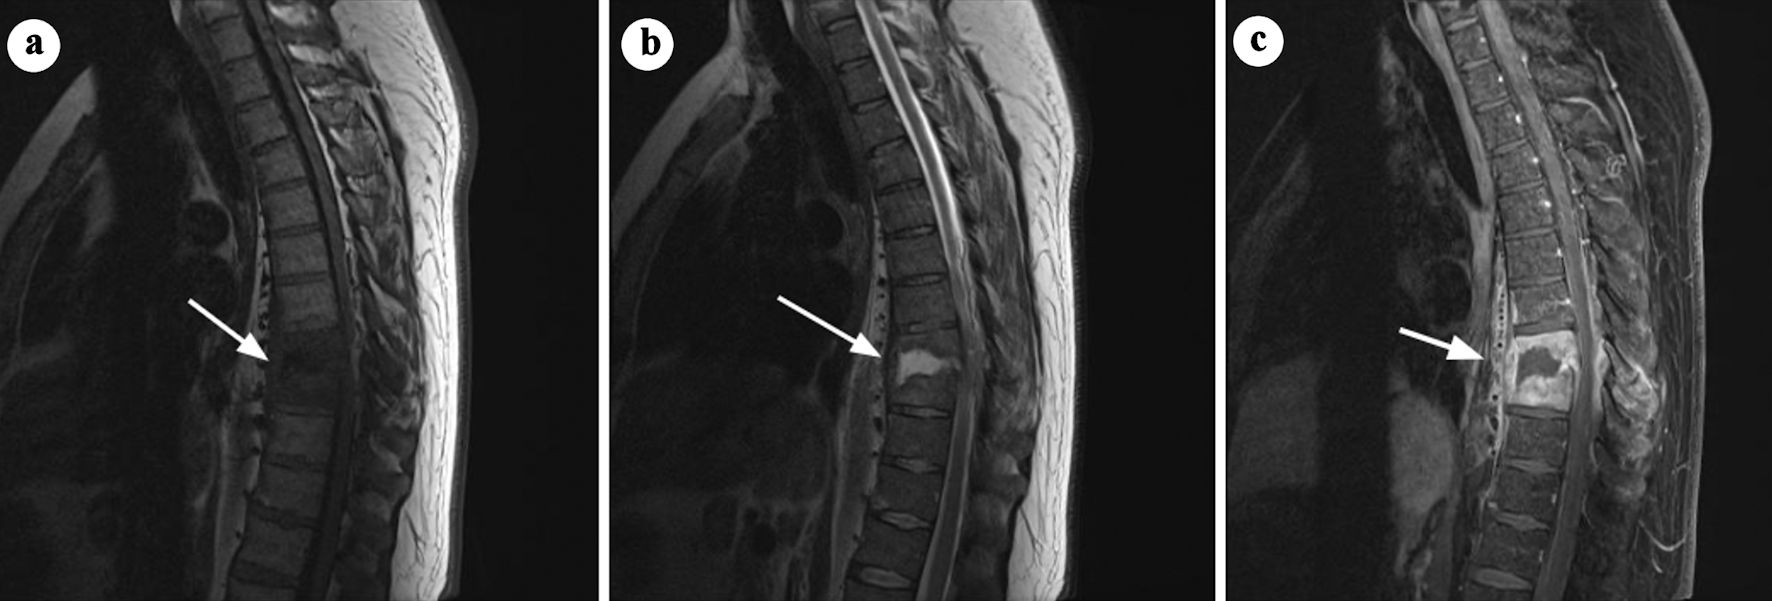
↓ Figure 2. Sagittal MRI images of discitis at
the T8/T9 level. (a) T1-weighted image showing destruction of the opposed endplates and loss of
vertebral body height at T8/T9 (arrow). (b) T2-weighted image demonstrating fluid collection within the
disc space and extensive phlegmon in the surrounding paravertebral soft tissues (arrow). (c)
Post-contrast T1-weighted imaging with fat saturation demonstrates enhancement of the phlegmon involving
the paravertebral and epidural spaces, resulting in focal spinal canal narrowing (arrow). No evidence of
epidural abscess is observed. Adapted from Di Muzio et al [12]. MRI: magnetic resonance imaging.
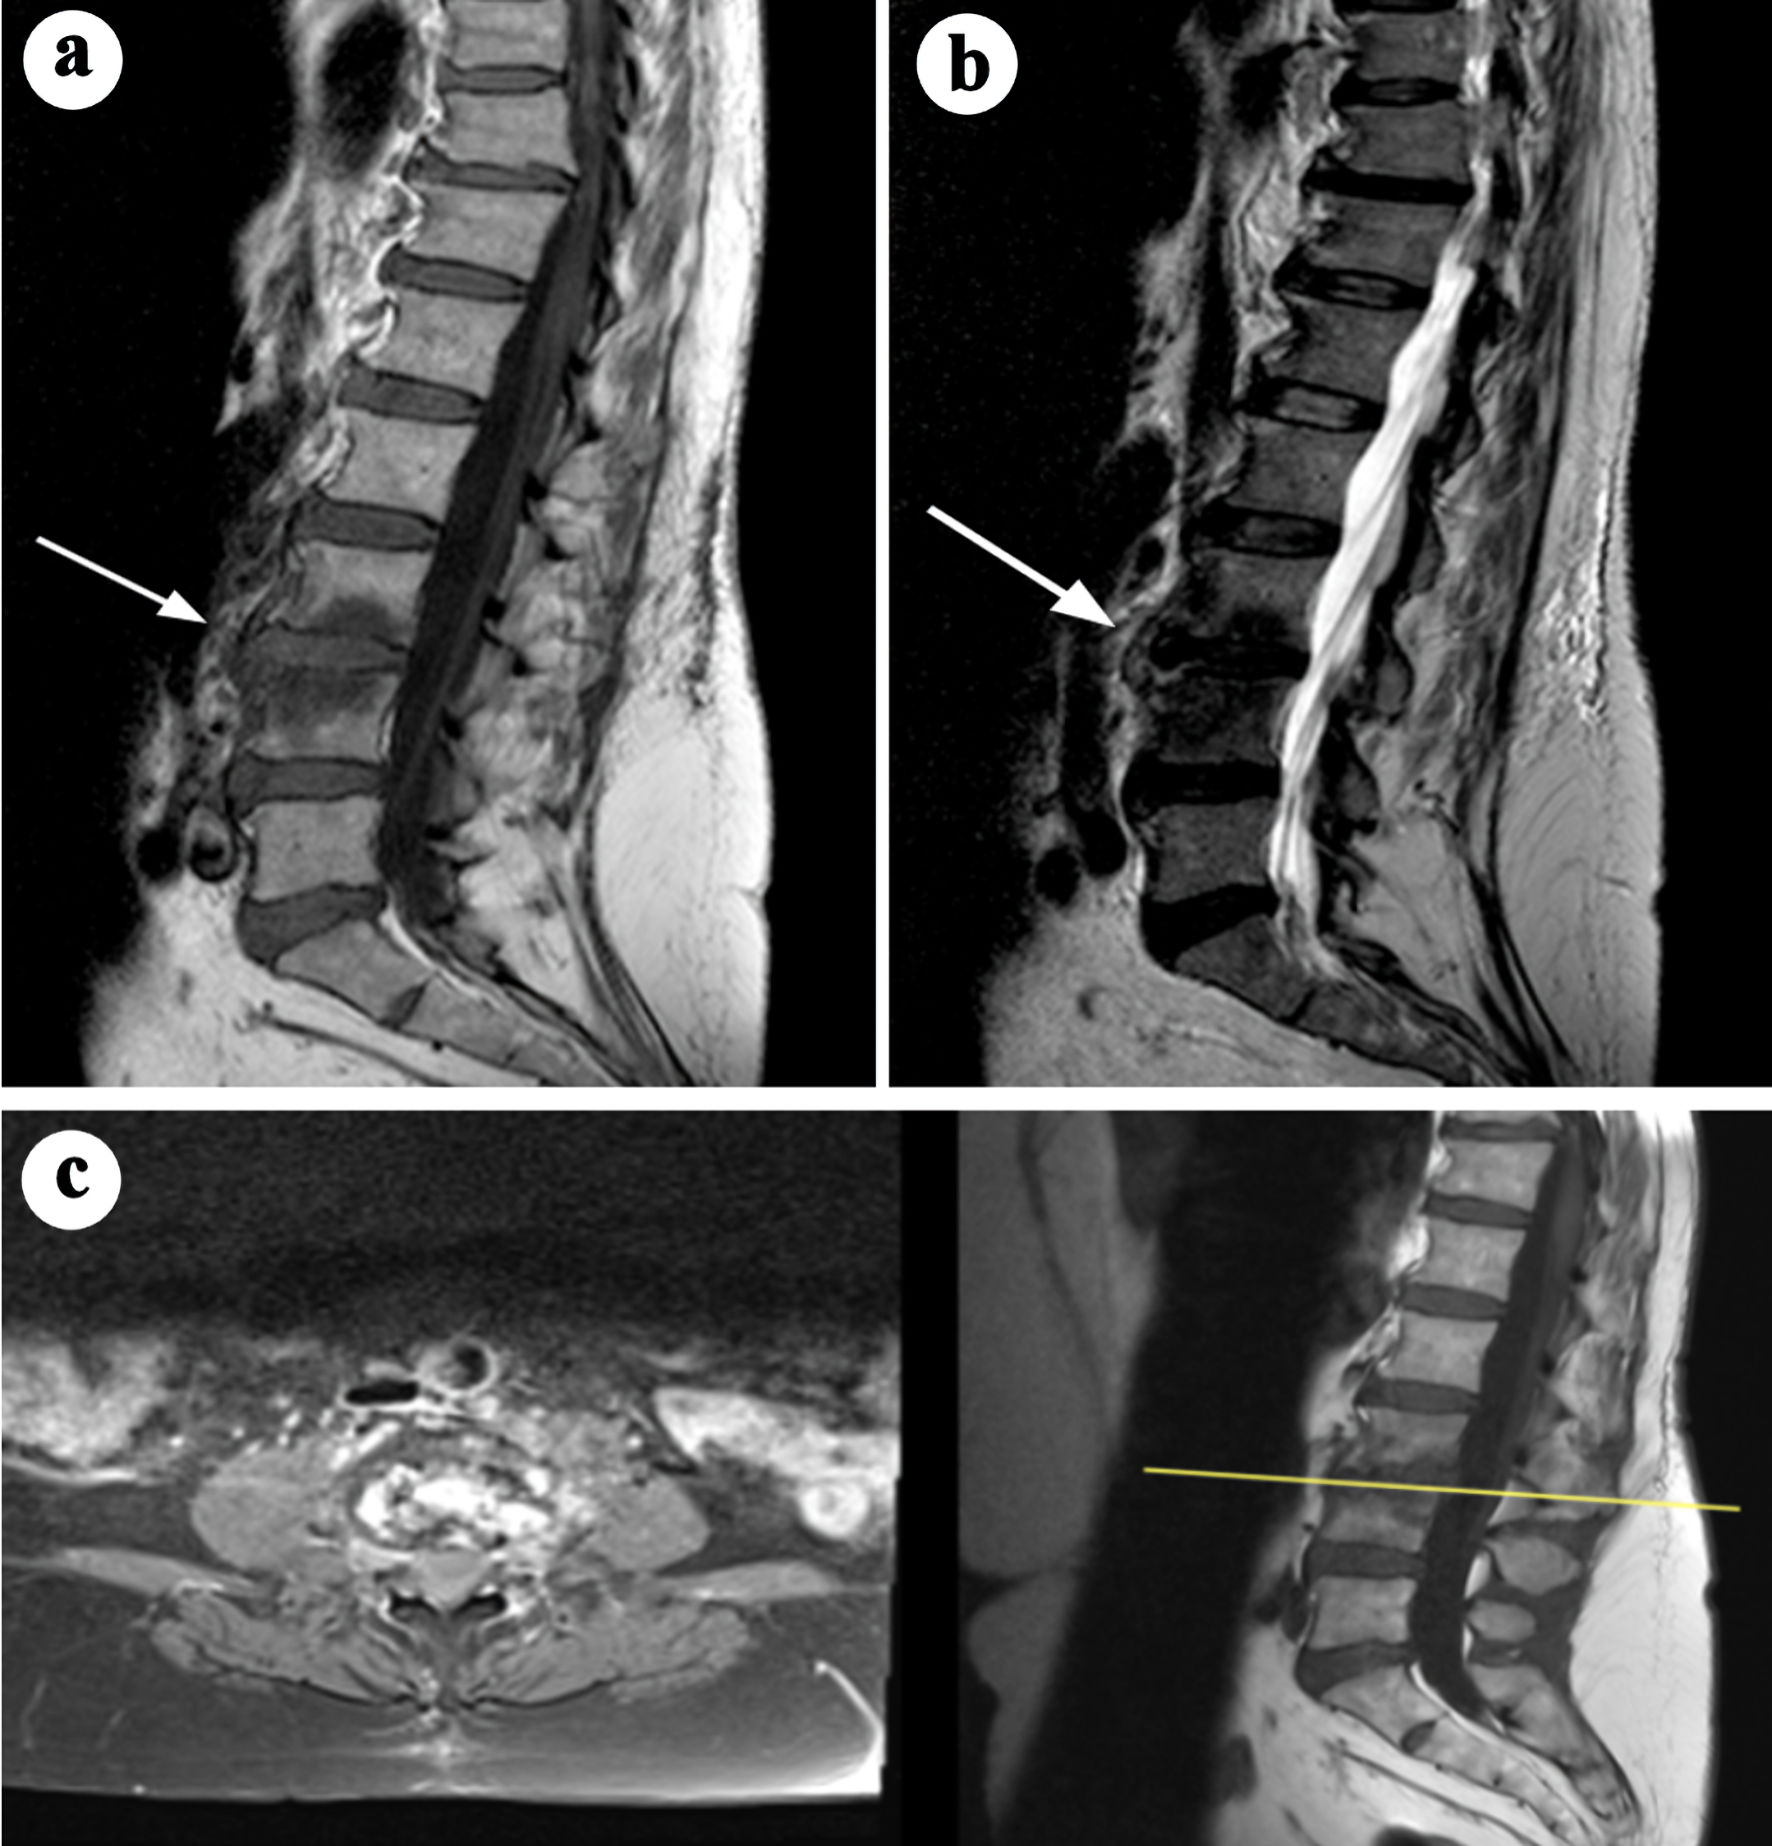
↓ Figure 3. Sagittal and axial MRI images
demonstrating features of spondylitis at the L3-L4 level. (a) T1-weighted sagittal MRI showing
hypointense signal in the L3-L4 vertebral endplates and adjacent vertebral bodies, consistent with
inflammation (arrow). (b) T2-weighted sagittal MRI illustrating hyperintense signal in the affected
region, indicative of edema (arrow). (c) Axial and sagittal short tau inversion recovery (STIR) images
with contrast enhancement highlighting abnormal enhancement in the L3-L4 region. Small paraspinal
abscesses are also identified, confirming active infection. Adapted from Aguiar et al [13] (rID: 67347).
MRI: magnetic resonance imaging.
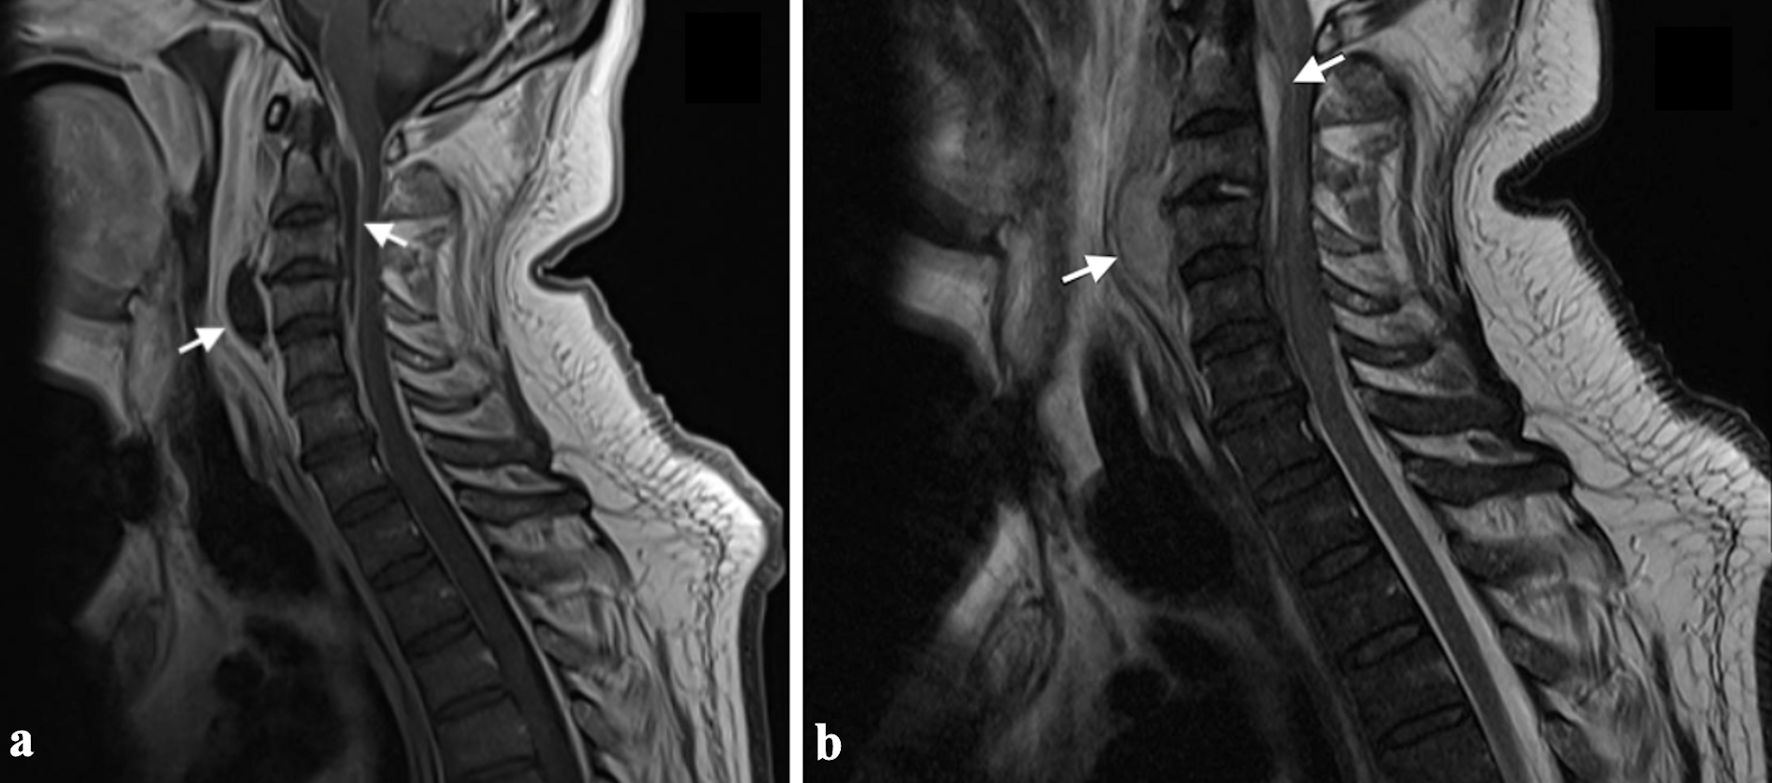
↓ Figure 4. MRI images demonstrating a spinal
epidural abscess with associated prevertebral abscess. (a) Sagittal T2-weighted MRI reveals an anterior
epidural abscess (C1-C4) compressing the spinal cord, with a hyperintense T2 signal and evidence of a
prevertebral abscess at C3-C4 (arrows). (b) Sagittal T1-weighted MRI shows hypointense signals
corresponding to the epidural and prevertebral abscesses, consistent with fluid and inflammatory changes
(arrows). Adapted from Egidio de Sousa et al [29] (licensed under CC BY 4.0). MRI: magnetic resonance
imaging.
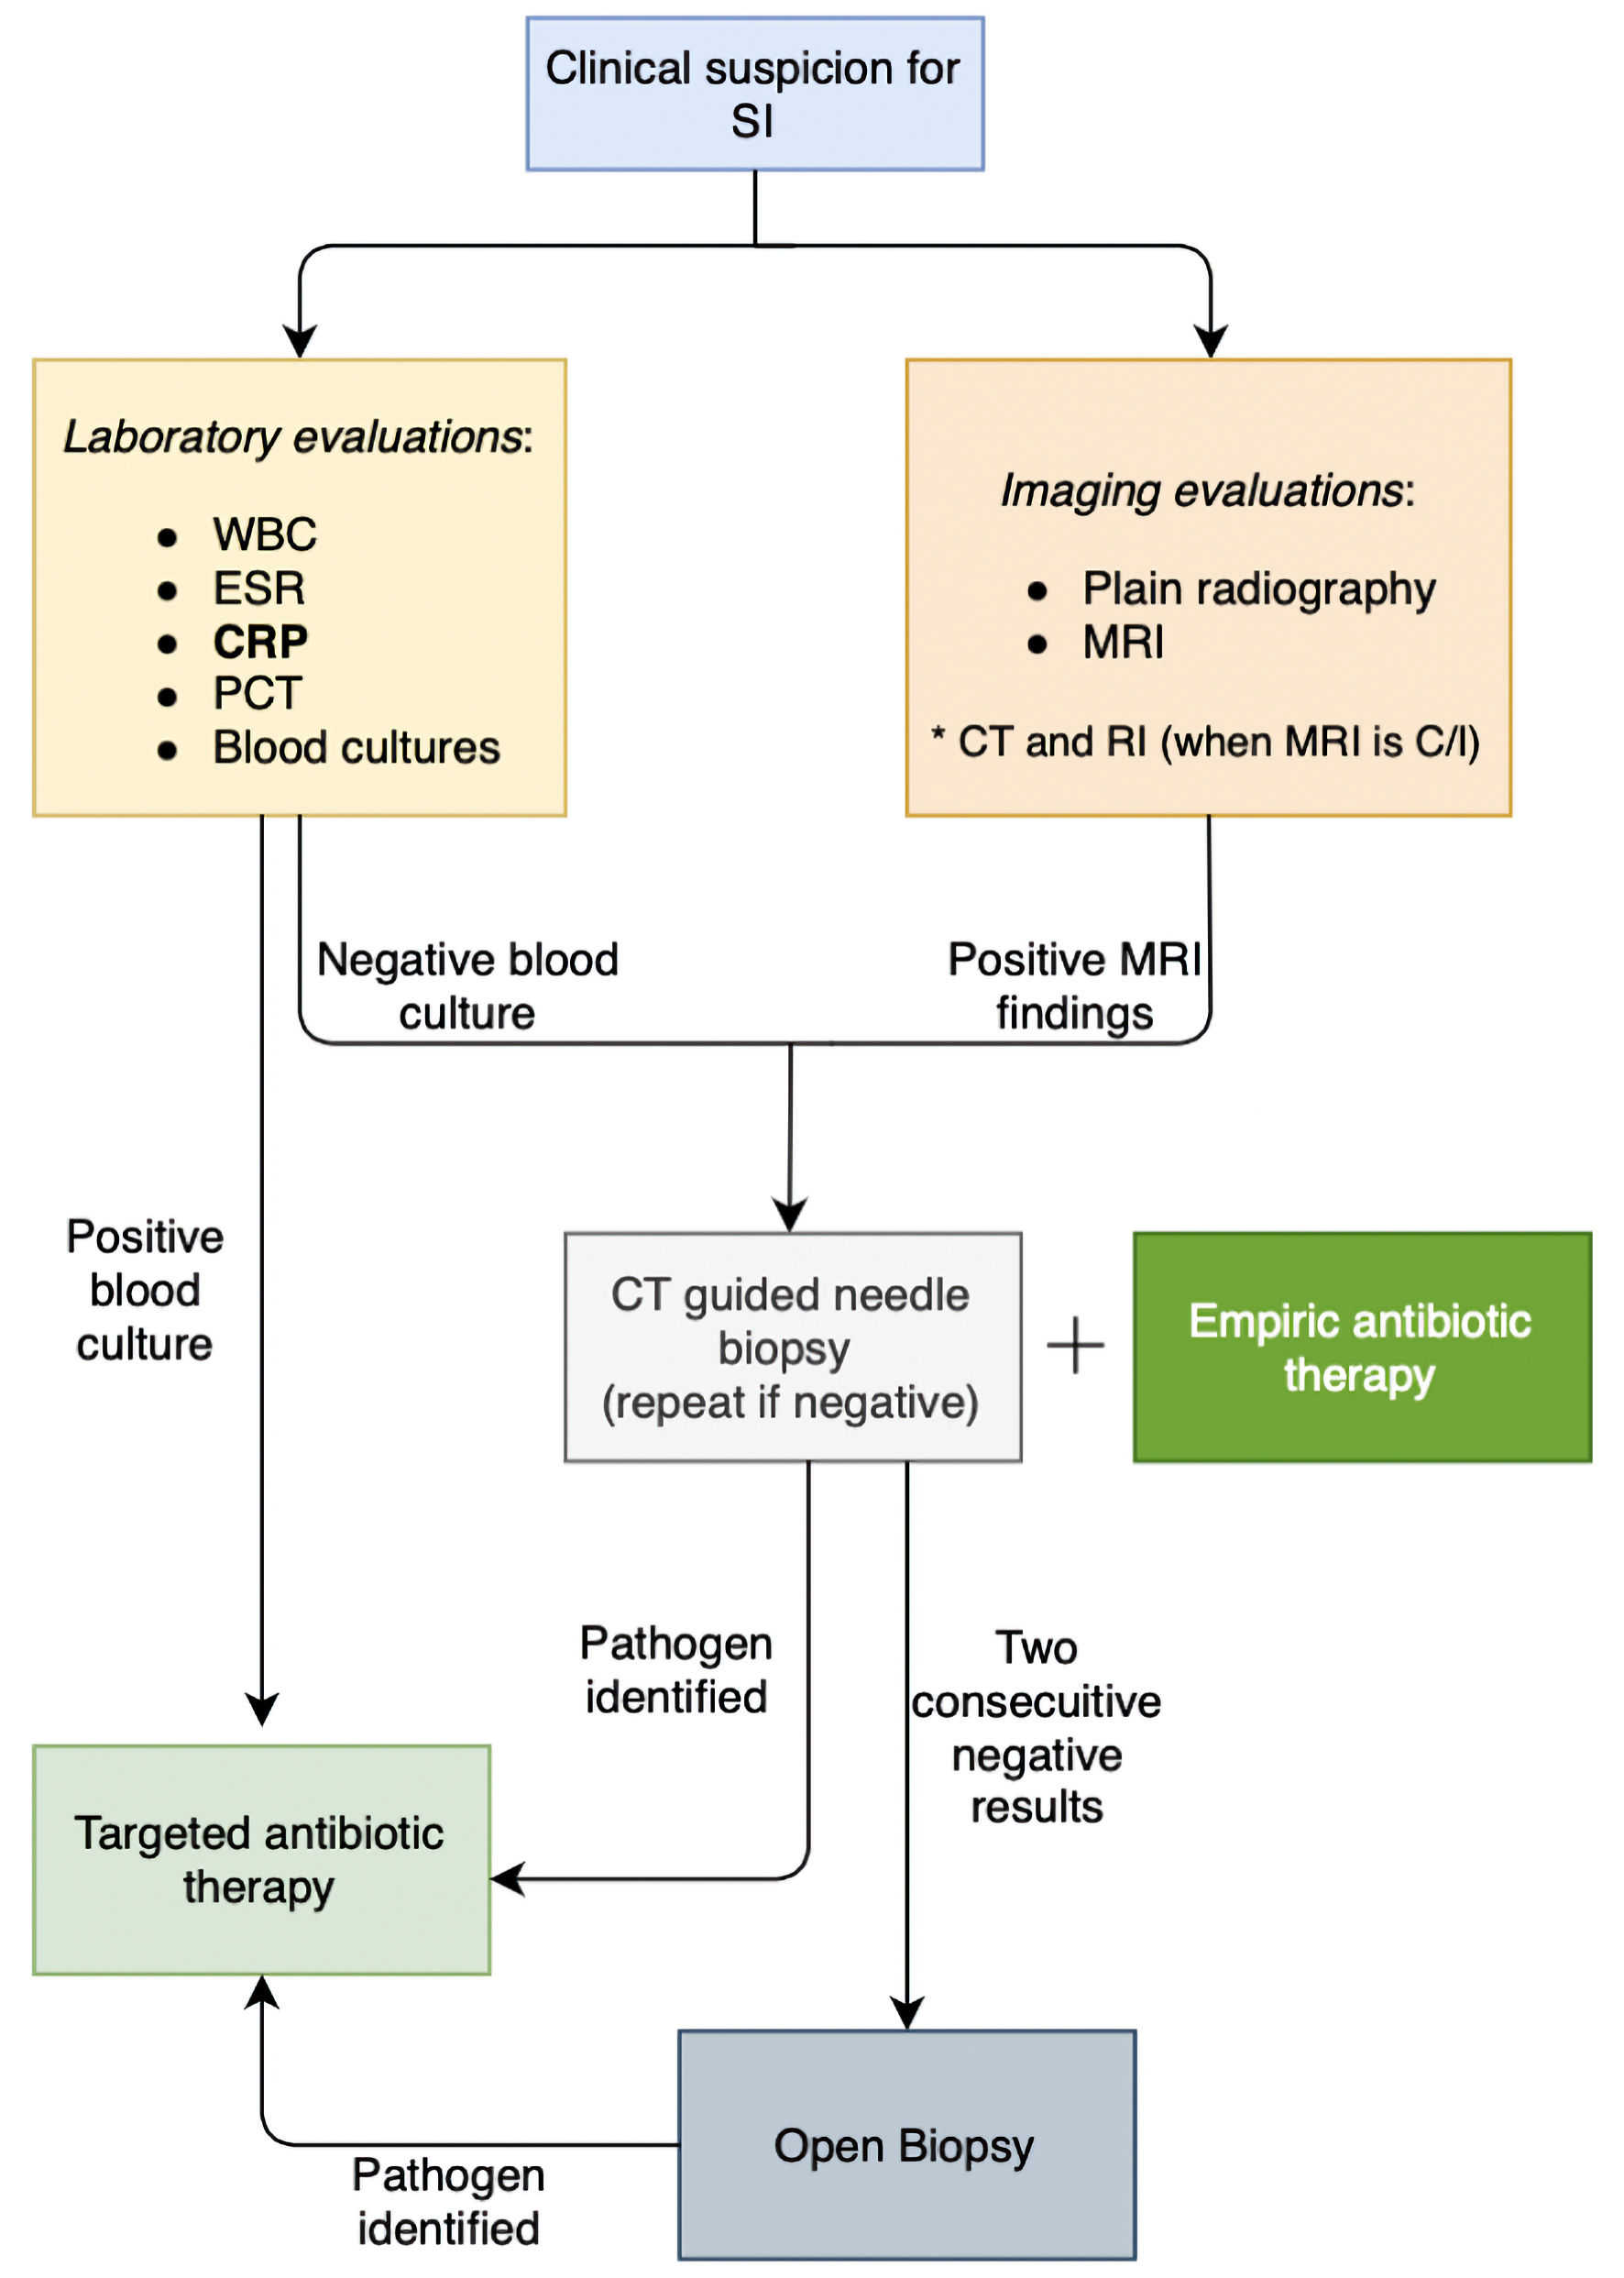
↓ Figure 5. Diagnostic approach to spinal
infections. SI: spinal infection; WBC: white blood cells; ESR: erythrocyte sedimentation rate; CRP:
C-reactive protein; MRI: magnetic resonance imaging; CT: computed tomography; RI: radionuclide imaging;
C/I: contraindicated.
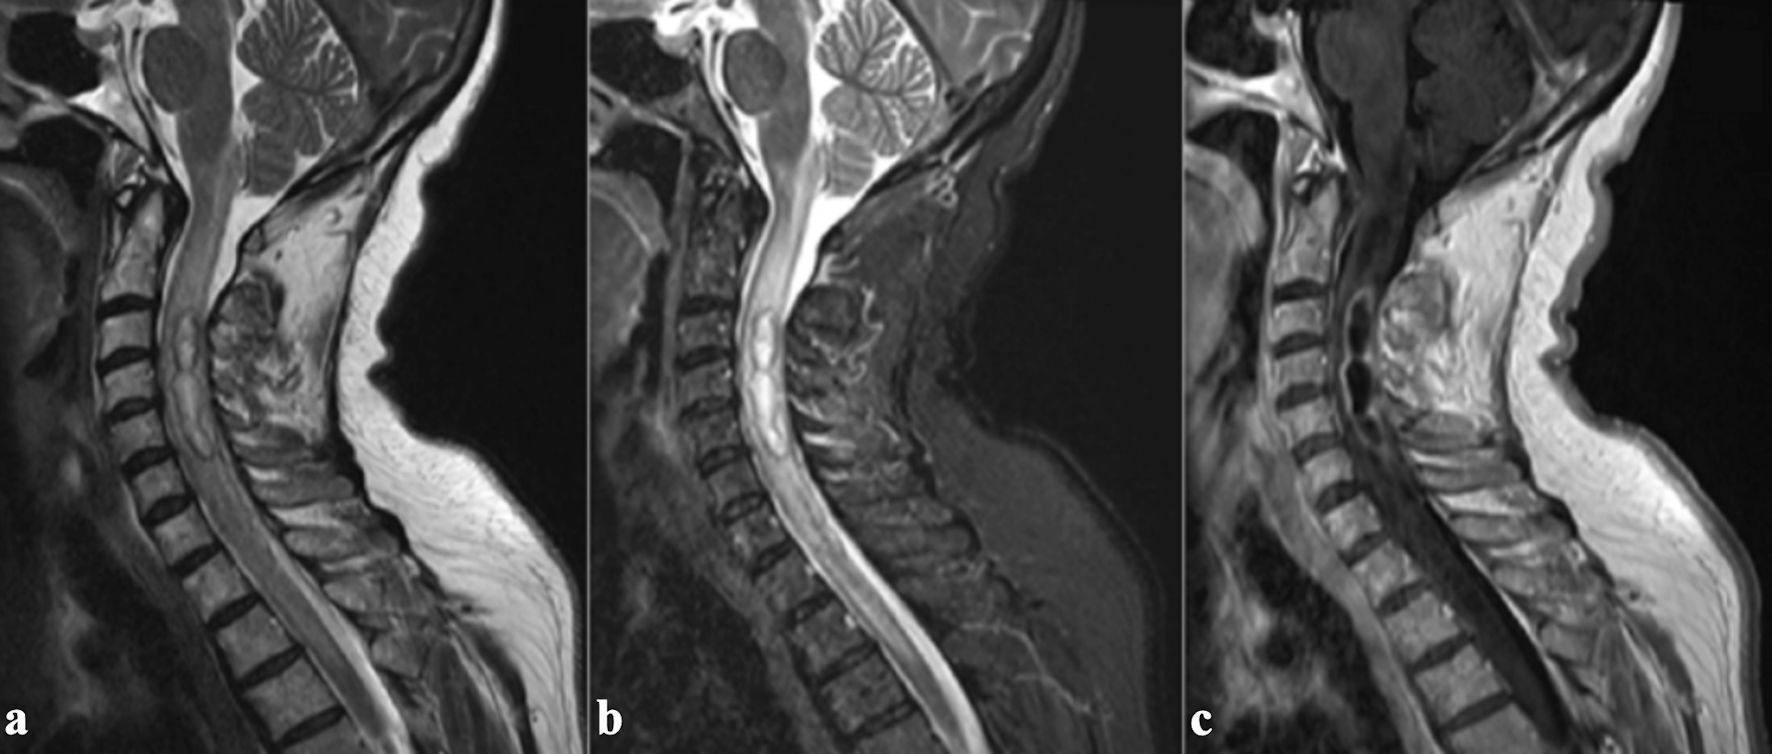
↓ Figure 6. MRI images illustrating the
radiological features of an intramedullary abscess in the cervical spinal cord. (a) Sagittal T2-weighted
MRI reveals an intramedullary hyperintense lesion within the cervical spinal cord, associated with
diffuse core expansion and surrounding edema. (b) Short tau inversion recovery (STIR) sequence further
highlights the hyperintense lesion and associated edema. (c) Post-contrast sagittal T1-weighted image
demonstrates continuous peripheral ring enhancement. Adapted from Cerecedo-Lopez et al [41] (licensed
under CC BY 4.0). MRI: magnetic resonance imaging.
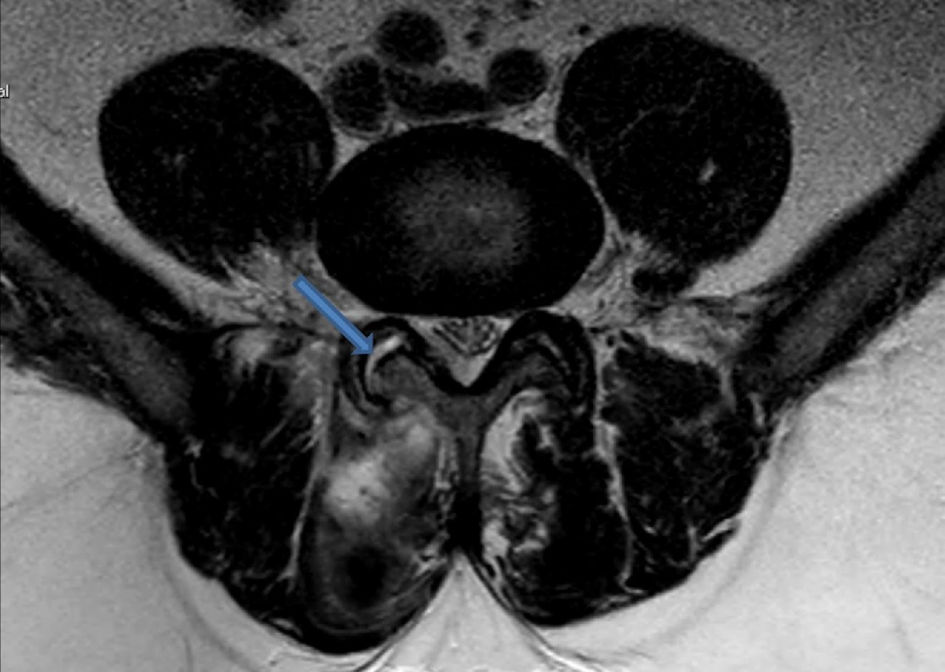
↓ Figure 7. Axial T2-weighted MRI image
illustrating fluid collection within the right facet joint, consistent with findings of septic
arthritis. The hyperintense signal in the joint space (blue arrow) indicates inflammation. Adapted from
Rajeev et al [28] (licensed under CC BY 4.0). MRI: magnetic resonance imaging.
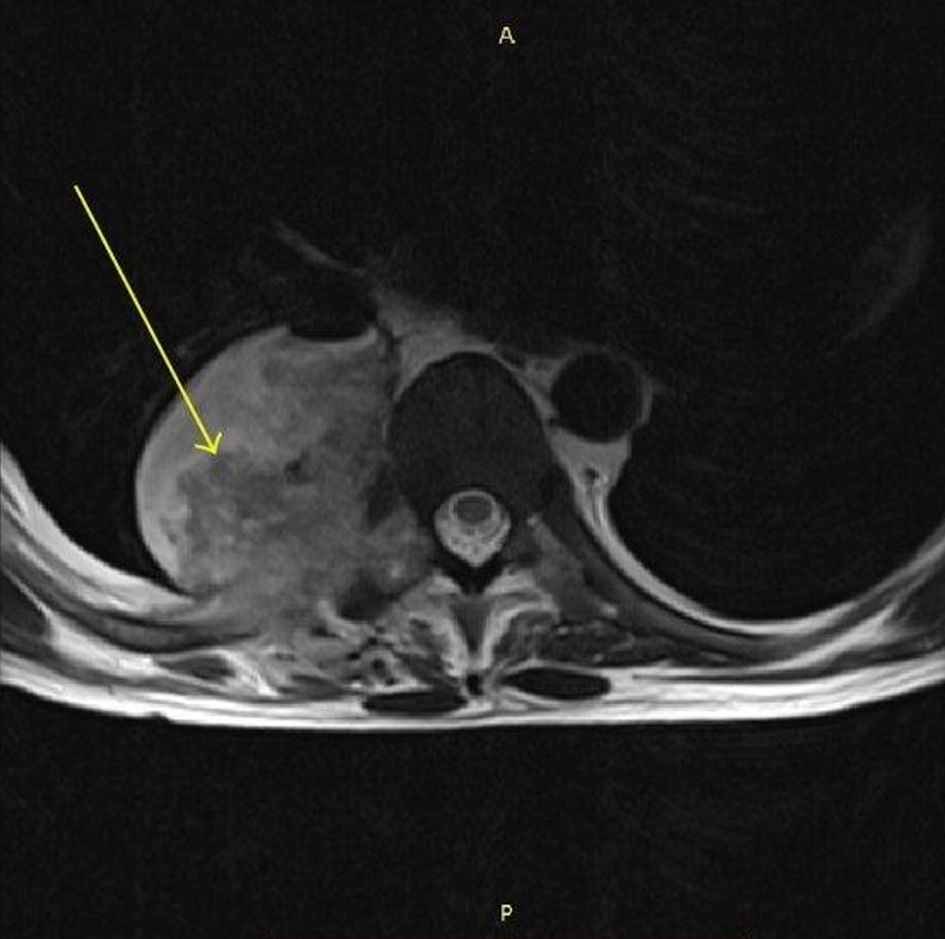
↓ Figure 8. MRI spine (axial T1-weighted) showing
a paraspinal abscess on the right side with an air-fluid level (arrow). Adapted from the study of
Eswarappa et al [45] (licensed under CC BY 3.0, image modified by the authors to include an annotation
(yellow arrow)). MRI: magnetic resonance imaging.
↓ Figure 9. MRI images demonstrating spinal
subdural empyema with associated fluid collections. (a) On sagittal T2-weighted imaging, large loculated
fluid collections are observed, resulting in ventral compression of the spinal cord between T12 and L2
and dorsal compression extending from T8 to T12, with associated T2 hyperintensity involving the distal
thoracic cord and conus at T11-T12. (b) Sagittal T1-weighted MRI without contrast shows anterior
displacement of the spinal cord from T9-T12 levels. (c) Sagittal T1-weighted MRI with contrast
demonstrates distinct enhancement of fluid collections at T8-T12 and T12-L2, as well as enhancement of
the leptomeninges and nerve roots within the cauda equina, findings consistent with inflammation.
Adapted from Basheer et al [43] (licensed under CC BY 3.0). MRI: magnetic resonance imaging.