Figures
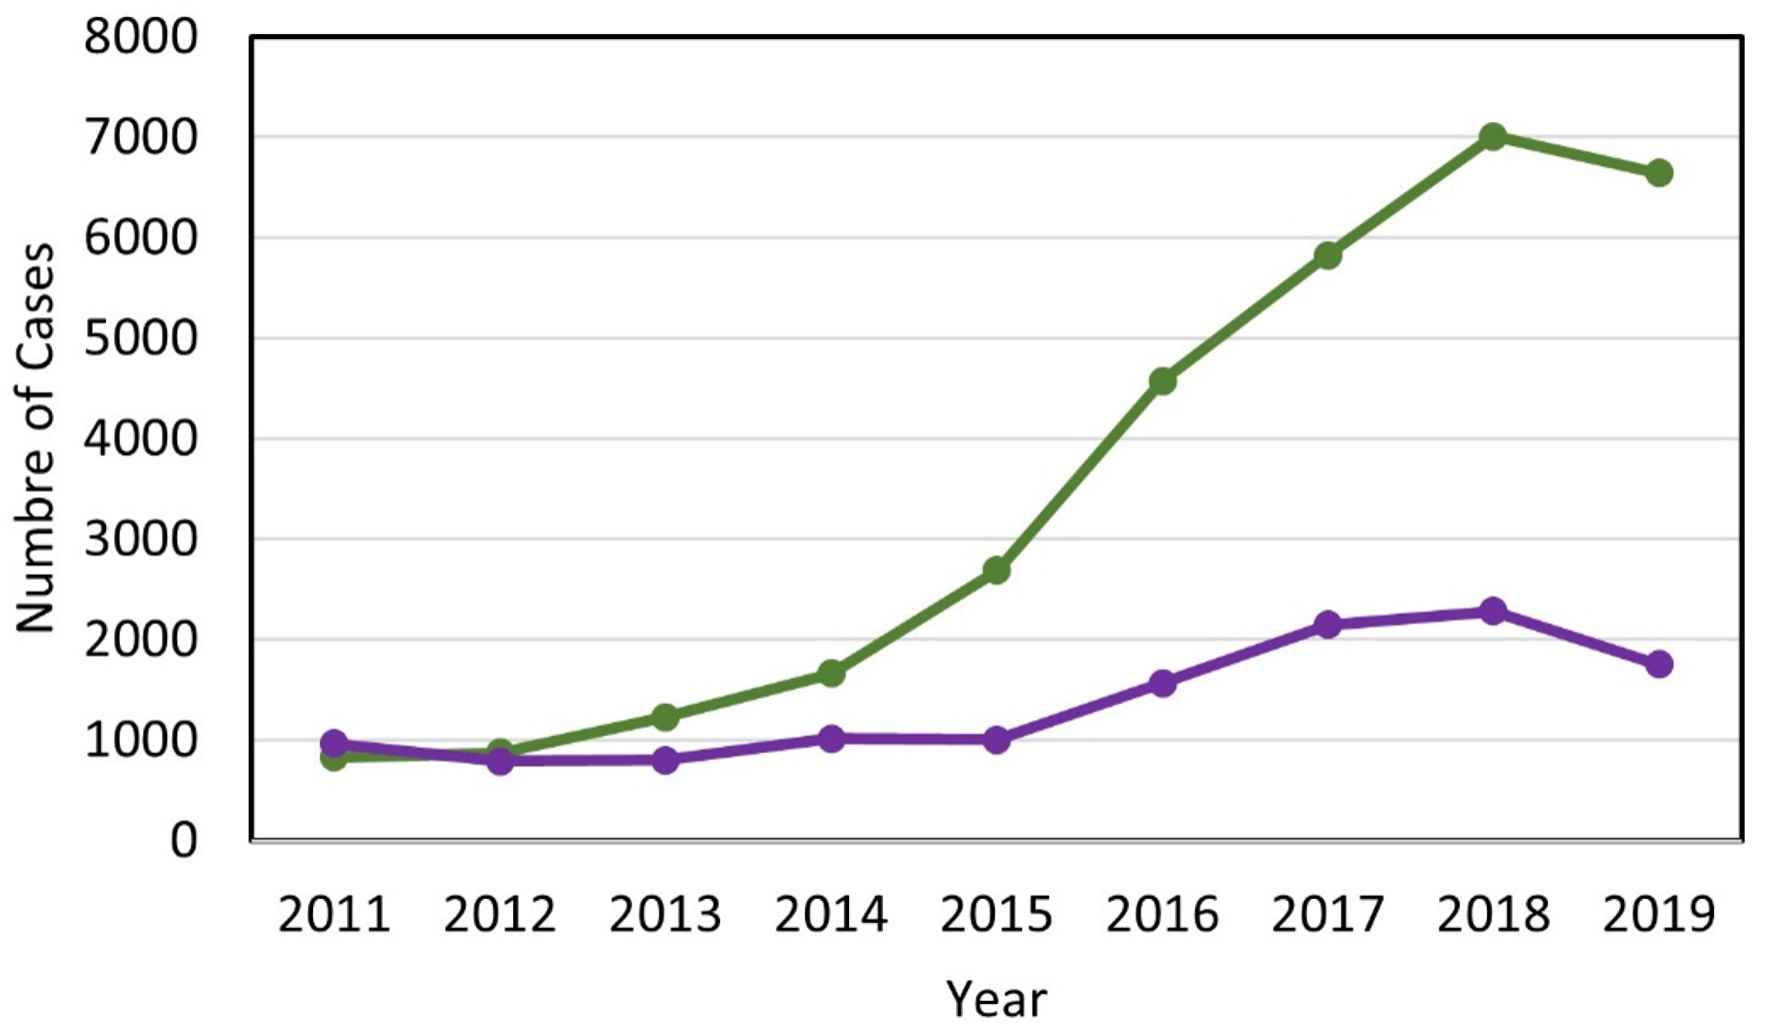
↓ Figure 1. Trends in syphilis cases in Japan and
South Korea from 2011 to 2019. Lines represent the number of reported cases in Japan (green) and South
Korea (purple).
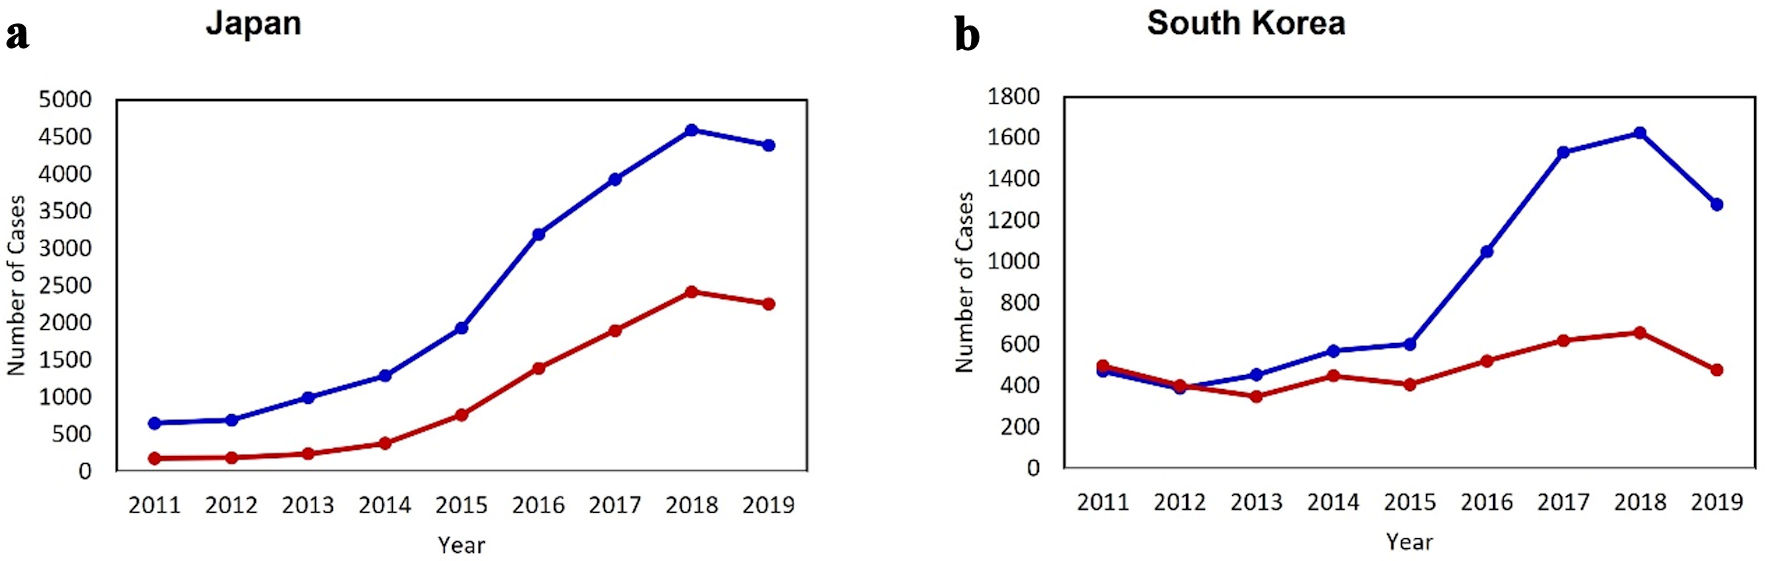
↓ Figure 2. Trends in syphilis cases of male and
female in Japan (a) and South Korea (b), from 2011 to 2019. Lines represent the number of reported cases
of male (blue) and female (red) in both countries.
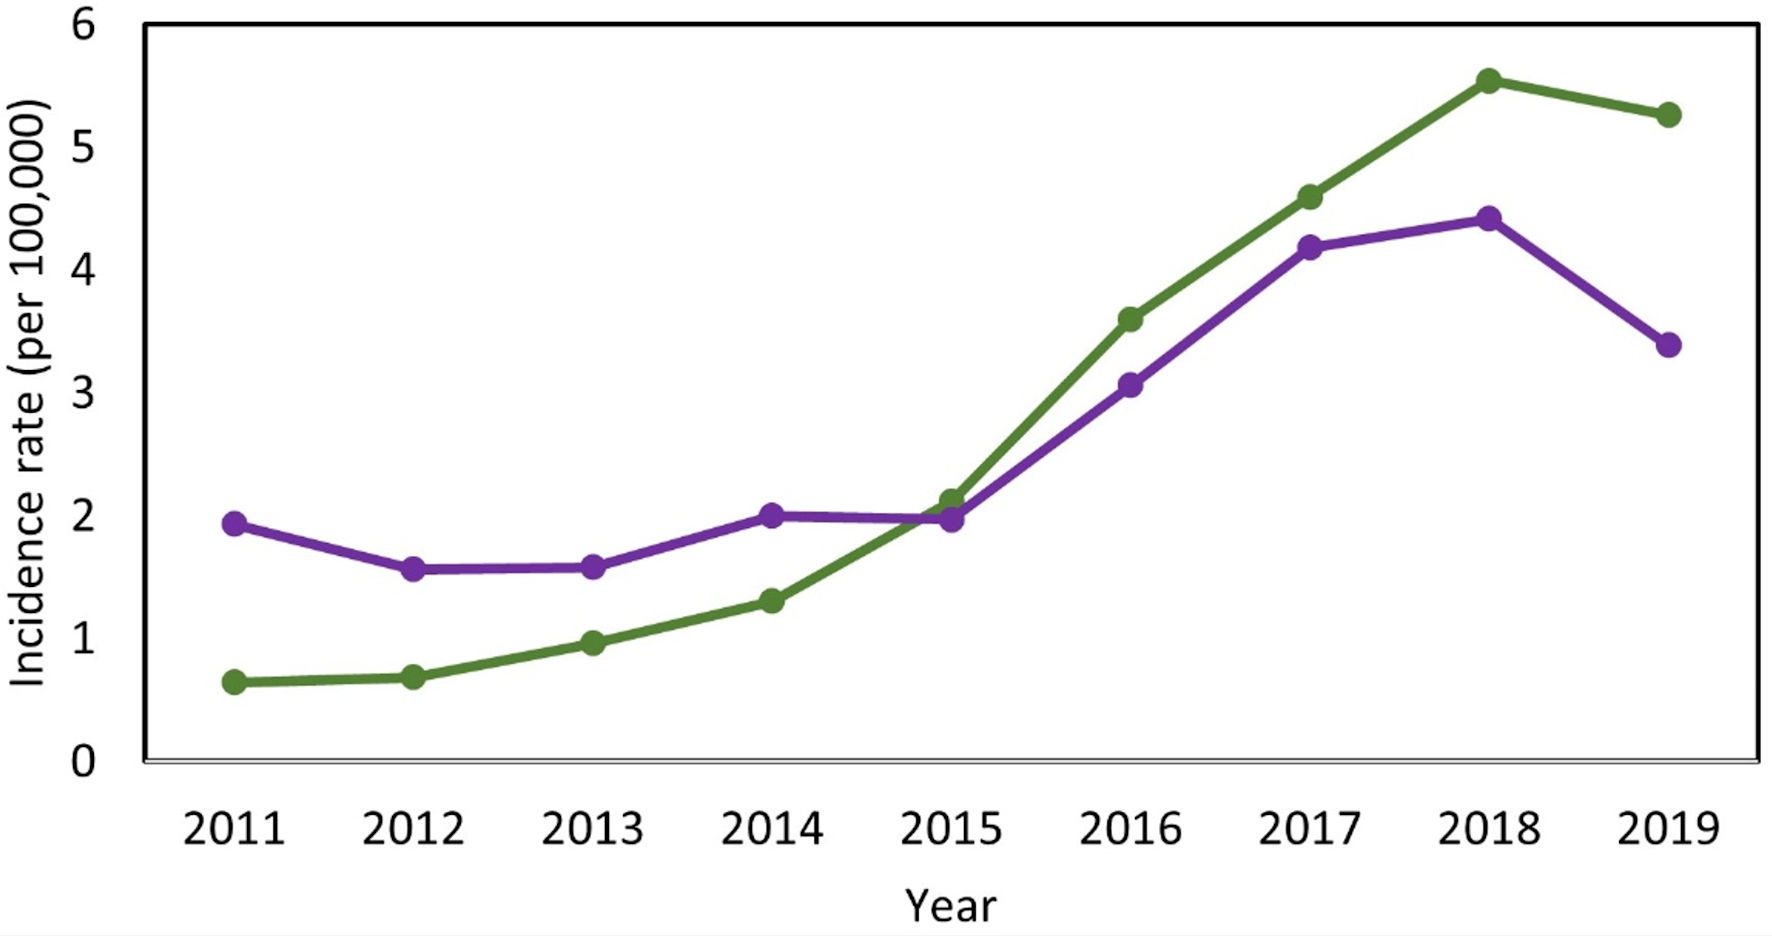
↓ Figure 3. Trends in syphilis incidence rate of
Japan and South Korea (2011 - 2019). Lines represent incidence rate of Japan (green) and South Korea
(purple).
↓ Figure 4. Trends in syphilis incidence rate of
male and female in Japan (a) and South Korea (b) (2011 - 2019). Lines represent the number of reported
cases of Japan (green) and South Korea (purple).

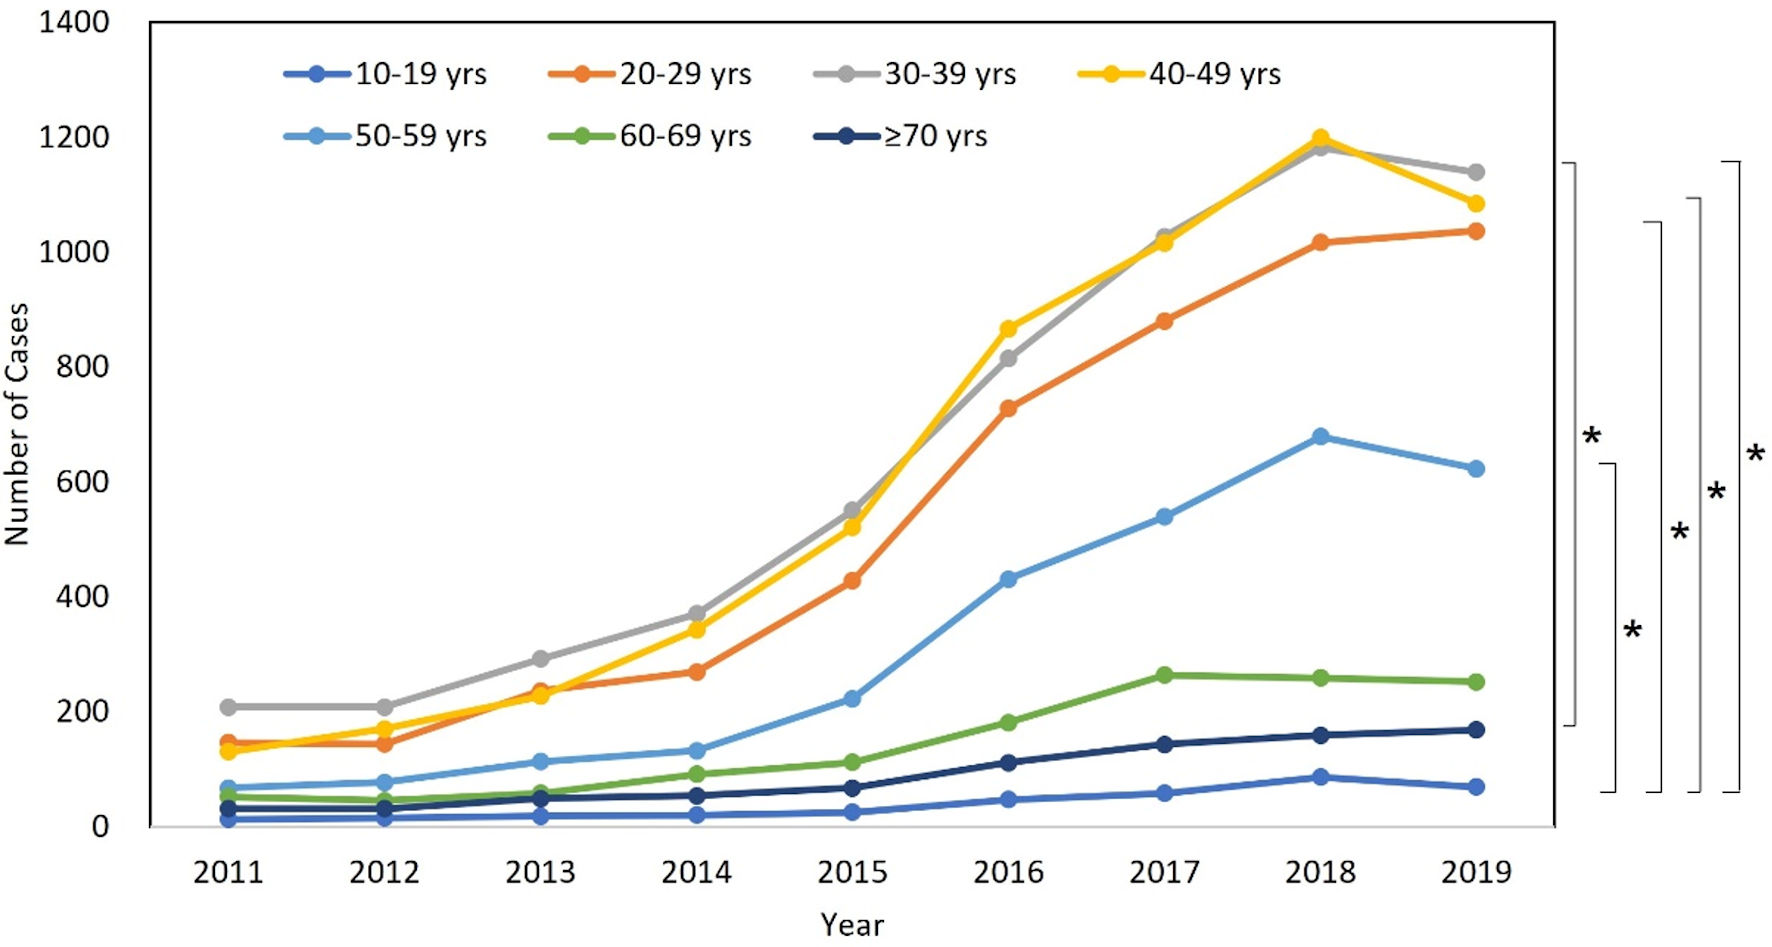
↓ Figure 5. Trends in age-specific syphilis cases
of male in Japan (2011 - 2019). The number of syphilis cases for each year is shown for different age
groups. The statistical analysis was performed with Kruskal-Wallis test for a global assessment among
the age-specific groups, followed by Bonferroni-adjusted pairwise comparisons, with a P value of 0.05 as
the significance level. There were significant differences between 10 - 19 years and 20 - 29 years (P =
0.001), 10 - 19 years and 30 - 39 years (P = 0.009), 10 - 19 years and 40 - 49 years (P = 0.001), 10 -
19 years and 50 - 59 years (P = 0.006), and 30 - 39 years and ≥ 70 years (P = 0.009). The
asterisks indicate the significant intergroup difference with the P value of less than 0.05. yrs:
years.
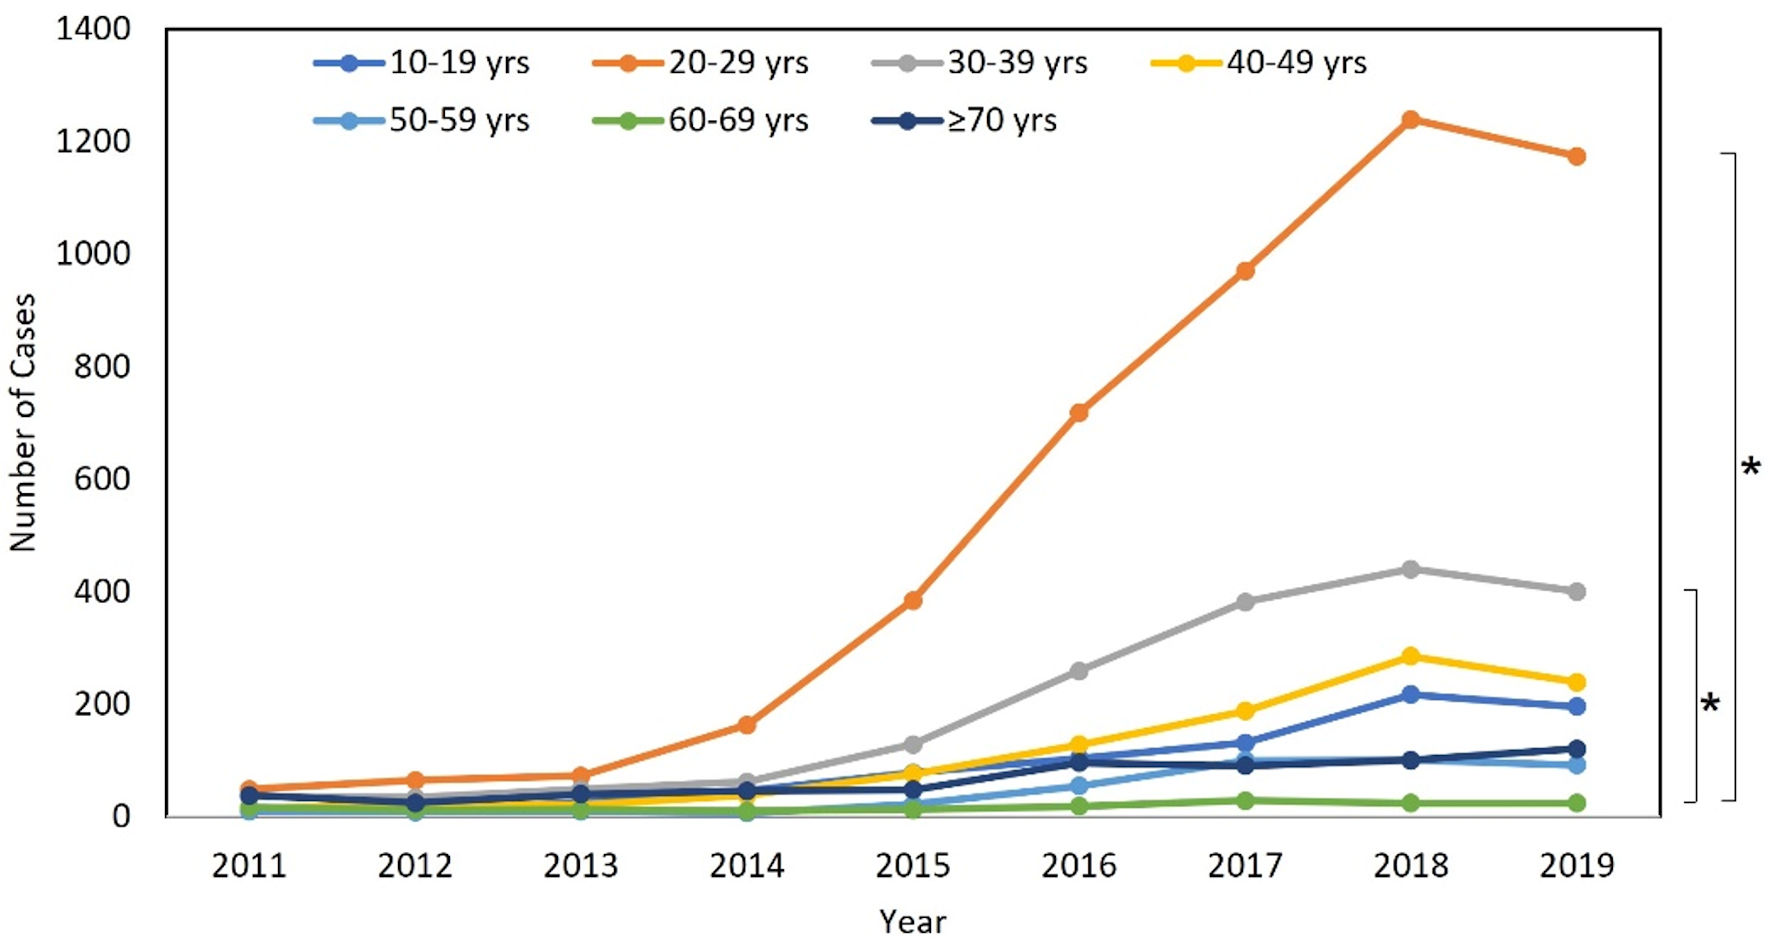
↓ Figure 6. Trends in age-specific syphilis cases
of male in South Korea (2011 - 2019). The number of syphilis cases for each year is shown for different
age groups. The statistical analysis was performed with Kruskal-Wallis test for a global assessment
among the age-specific groups, followed by Bonferroni-adjusted pairwise comparisons, with a P value of
0.05 as the significance level. There were significant differences between 10 - 19 years and 20 - 29
years (P = 0.001), 10 - 19 years and 30 - 39 years (P = 0.001), 10 - 19 years and 40 - 49 years (P =
0.002), 20 - 29 years and 60 - 69 years (P = 0.001), 20 - 29 years and ≥ 70 years (P = 0.009), 30
- 39 years and 60 - 69 years (P = 0.01), 30 - 39 years and ≥ 70 years (P = 0.009), 40 - 49 years
and 60 - 69 years (P = 0.01), 40 - 49 years and ≥ 70 years (P = 0.009), and 50 - 59 years and
≥ 70 years (P = 0.03). The asterisks indicate the significant intergroup difference with the P
value of less than 0.05. yrs: years.
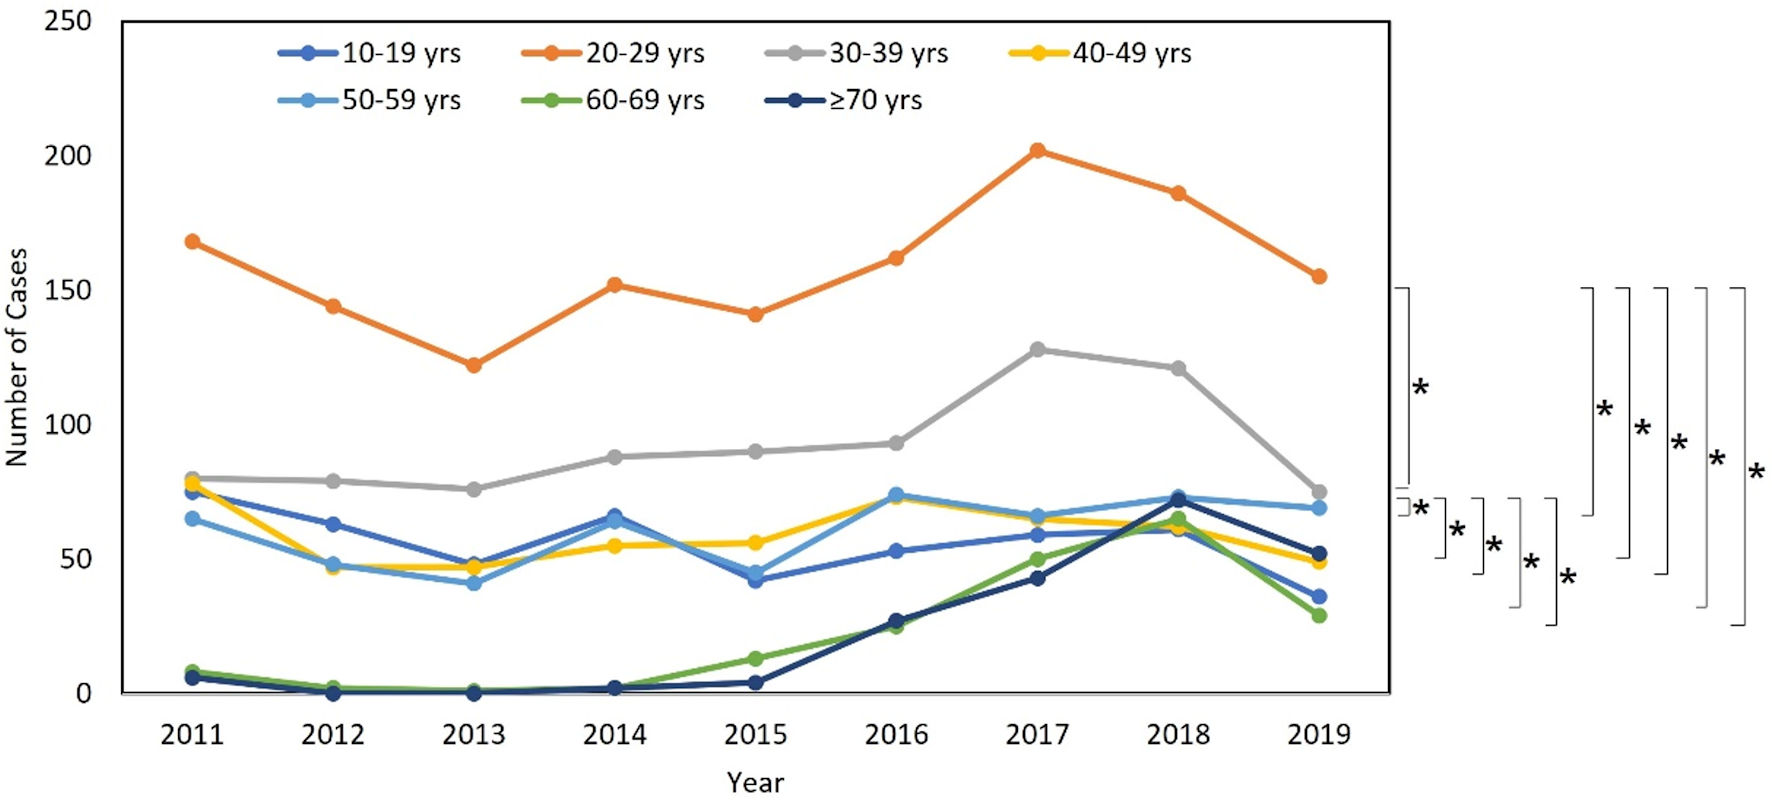
↓ Figure 7. Trends in age-specific syphilis cases
of female in Japan (2011 - 2019). The number of syphilis cases for each year is shown for different age
groups. The statistical analysis was performed with Kruskal-Wallis test for a global assessment among
the age-specific groups, followed by Bonferroni-adjusted pairwise comparisons, with a P value of 0.05 as
the significance level. There were significant differences between 20 - 29 years and 60 - 69 years (P =
0.009), and 30 - 39 years and 60 - 69 years (P = 0.009). The asterisks indicate the significant
intergroup difference with the P value of less than 0.05. yrs: years.
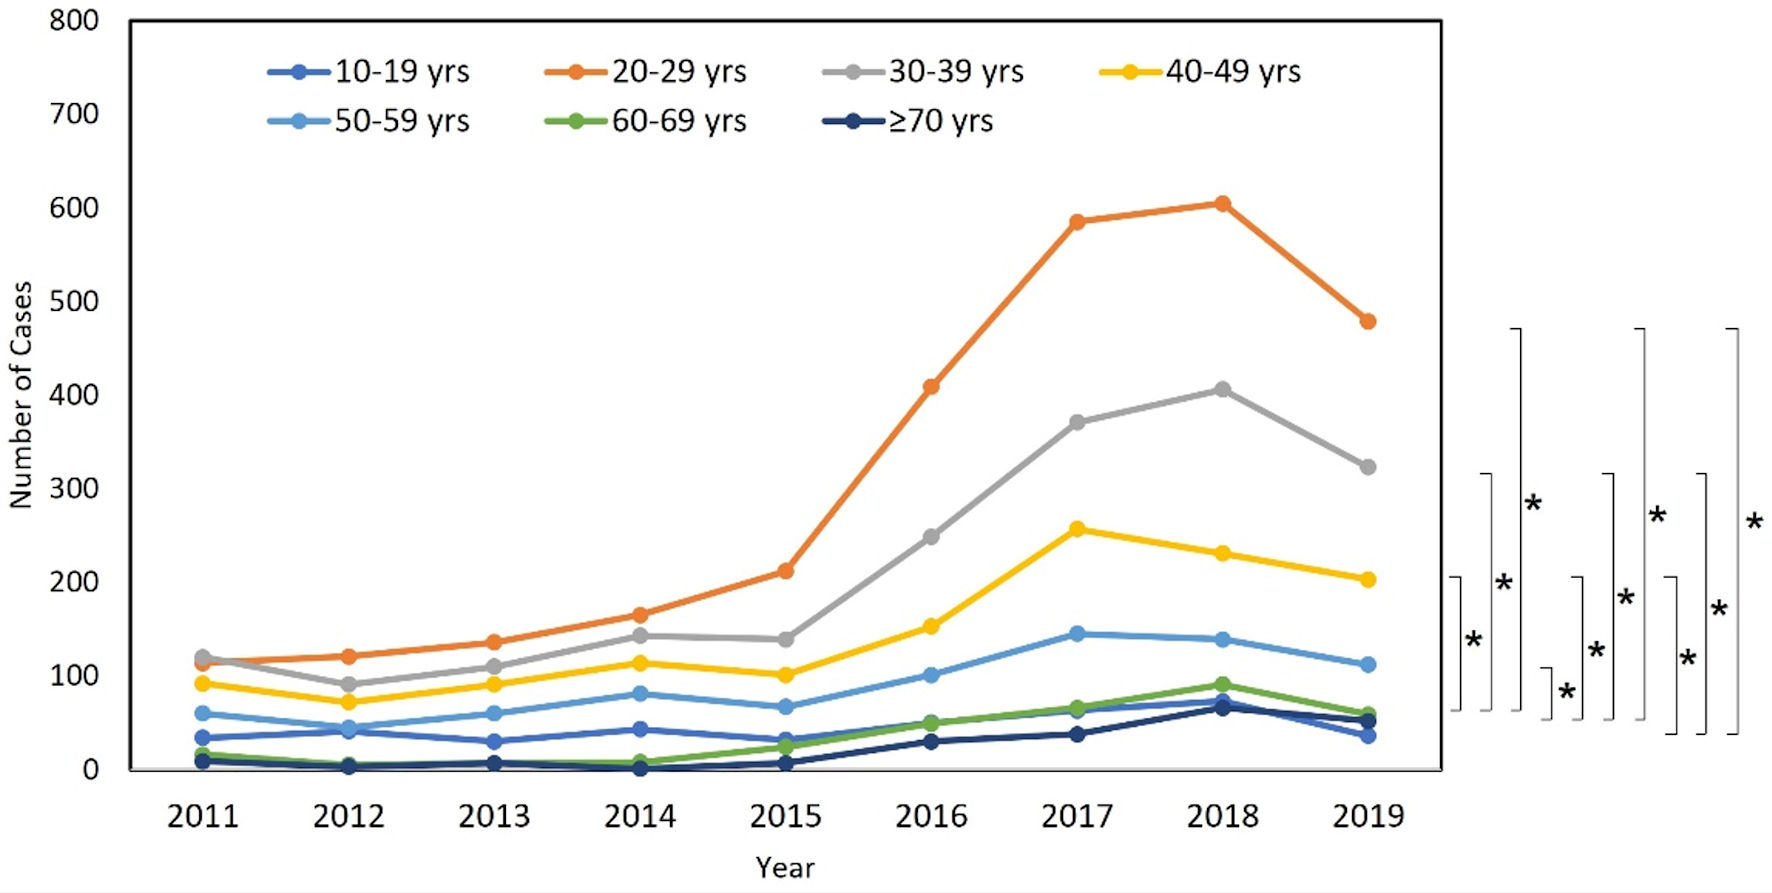
↓ Figure 8. Trends in age-specific syphilis cases
of female in South Korea (2011 - 2019). The number of syphilis cases for each year is shown for
different age groups. The statistical analysis was performed with Kruskal-Wallis test for a global
assessment among the age-specific groups, followed by Bonferroni-adjusted pairwise comparisons, with a P
value of 0.05 as the significance level. There were significant differences between 10 - 19 years and 20
- 29 years (P = 0.001), 10 - 19 years and 30 - 39 years (P = 0.01), 20 - 29 years and 30 - 39 years (P =
0.002), 20 - 29 years and 40 - 49 years (P = 0.009), 20 - 29 years and 50 - 59 years (P = 0.001), 20 -
29 years and 60 - 69 years (P = 0.009), 20 - 29 years and ≥ 70 years (P = 0.009), 30 - 39 years
and 40 - 49 years (P = 0.02), 30 - 39 years and 50 - 59 years (P = 0.001), 30 - 39 years and 60 - 69
years (P = 0.009), and 30 - 39 years and ≥ 70 years (P = 0.009). The asterisks indicate the
significant intergroup difference with the P value of less than 0.05. yrs: years.
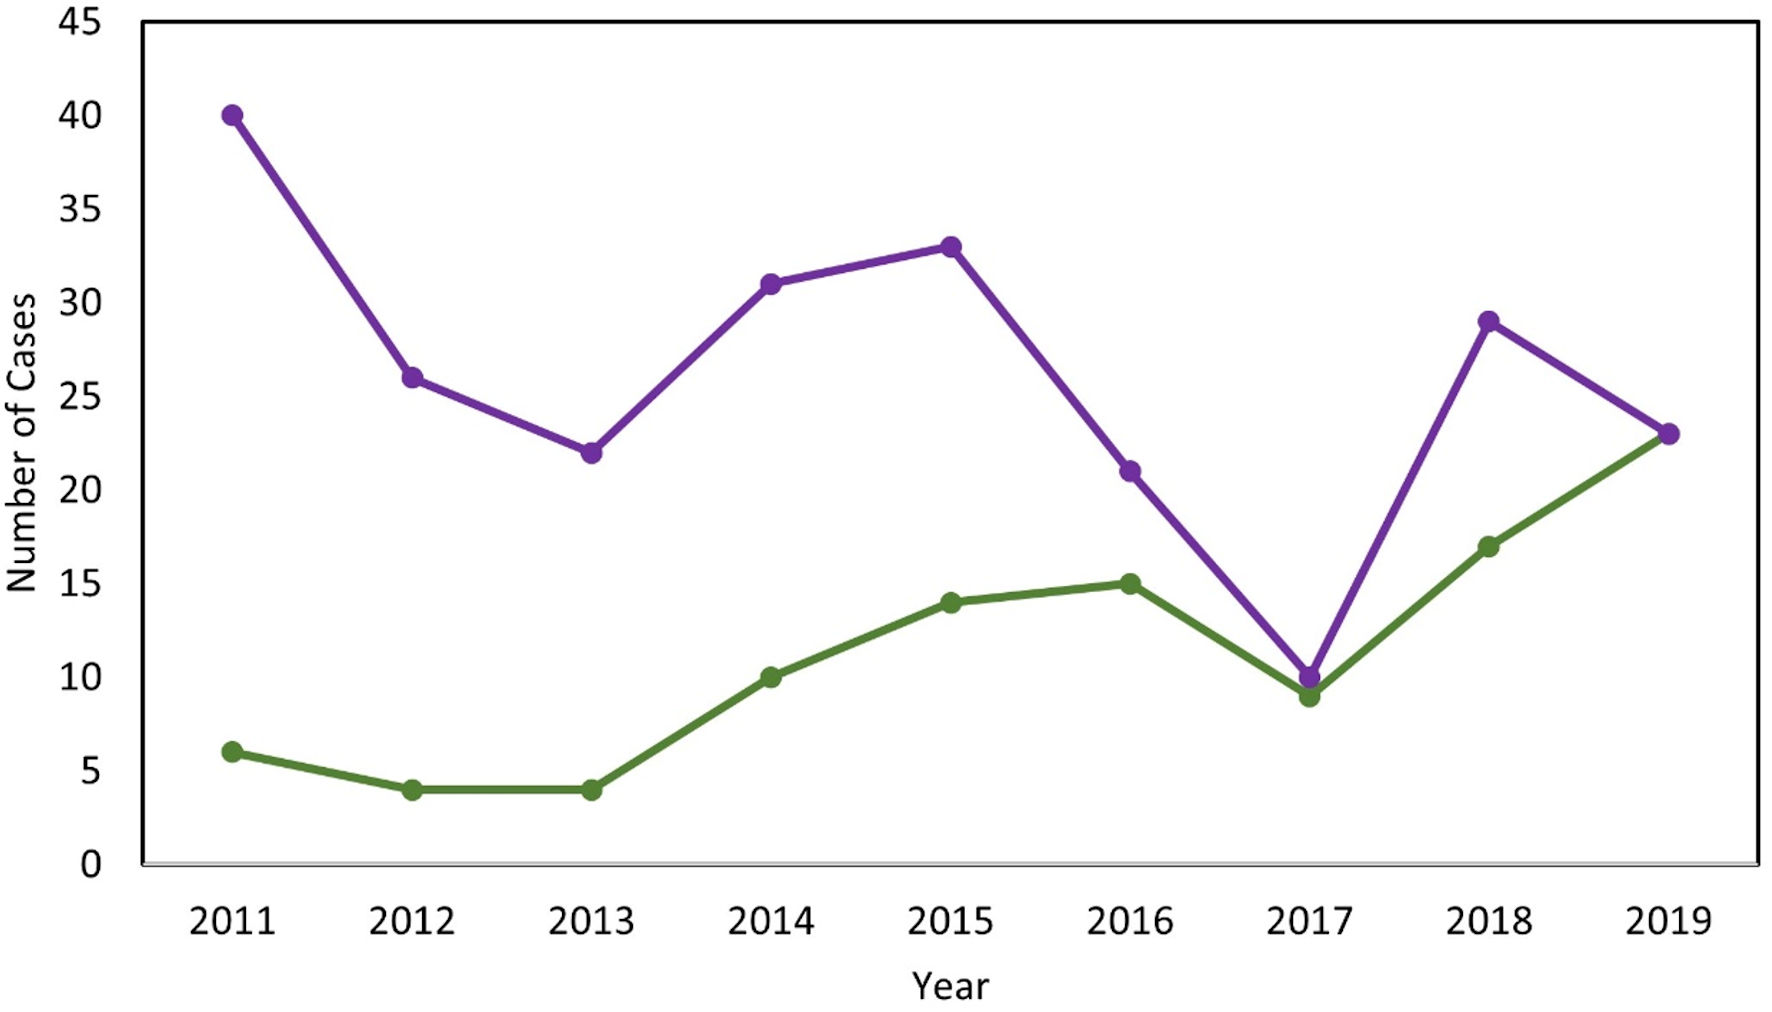
↓ Figure 9. Trends in congenital syphilis cases
in Japan and South Korea (2011 - 2019). Lines represent number of cases of Japan (green) and South Korea
(purple).